Real-Time Linux network traffic monitoring with Iftop
Iftop, one of the most popular command line tool for monitoring network traffic in Linux. Iftop command can quickly show you which source using most bandwidth by listing its IP address or hostname at the top of the output.
In this tutorial we will learn how to use iftop command to monitor network traffic on your Linux server. We will start with installing iftop on Ubuntu, CentOS 7 and Fedora, then we will learn the basic and advance options of the monitoring tool.
Install iftop on Ubuntu/CentOS 7/Fedora
Let's start by installing iftop command on Ubuntu, CentOS 7 and Fedora.
On Debian-based Linux systems (including Ubuntu), you can install iftop with the following command:
sudo apt-get update
sudo apt-get install iftop
To install iftop on CentOS 7, Run:
yum -y install epel-release
yum -y install iftop
In Fedora, Type:
dnf -y install iftopMonitoring Network traffic with iftop
Important: iftop command need root permission to listen to network traffic on Linux, so you need to login as root user or use sudo command.
Iftop command without any argument listen to network traffic on the first interface it can find.
iftop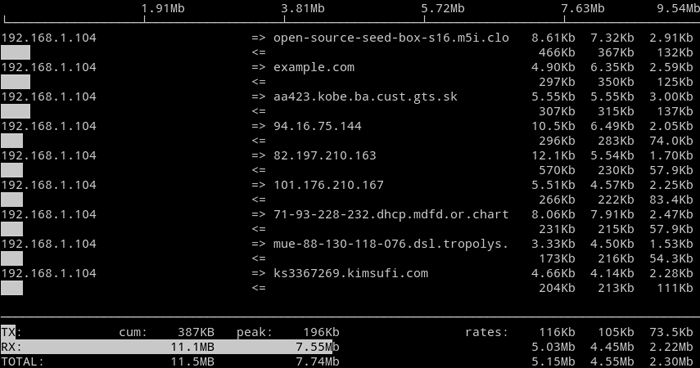
You can hit q to quit from the command output.
Most important argument is -i, to display the results for a specific network interface. For example, following command will display bandwidth usage on eth1 interface.
iftop -i eth1By default, iftop command will attempt to resolve IP addresses into a hostname, to avoid this use the -n option:
iftop -n -i eth1Command Output
The main part of the command output lists, for each pair of hosts, the rate at which data has been sent and received over the preceding 2, 10 and 40 second intervals. The direction of data flow is indicated by arrows, <= (received) and => (sent).
At the very bottom of the display, you can see statistics for the transmitted data (TX) and received data (RX) along with totals for all connections.
Controlling output from the Keyboard
| t | Use the t key to toggle between display modes (sent and received traffic on separate lines, sent traffic only, Received traffic only and total traffic). |
| Shift + p | Use the Shift + p key to pause the current display. |
| n | Press n key to turn on and off DNS resolution. |
| p | Port Display. p will toggle port display on/off (Both source and destination port). |
| Shift + s | Toggle source port display on/off. |
| Shift + d | Toggle destination port display on/off. |
| f | Apply filters to filter command output. |
Filtering Linux iftop Output
You can also filter the output of the iftop command with filter codes. To apply filter codes we use the -f option, or press the "f" key while iftop is running.
Iftop filter code use packet filter syntax use by tcpdump.
Examples
Following command will only listen if the source or destination of the packet is host 192.168.1.10:
iftop -i enp0s3 -f "host 192.168.1.10"Listen only if the packet is destined to host 192.168.1.10:
iftop -i enp0s3 -f "dst host 192.168.1.10"To apply filter code while iftop is running, press f key on the keyboard, type the expression and press enter (It will take a few seconds to the new filter to be applied).
More iftop filter codes
Ignore all broadcast traffic:
not ether host ff:ff:ff:ff:ff:ffMonitor HTTP traffic on port 80:
port 80Monitor SMTP traffic on IP address 192.168.1.10:
port smtp and host 192.168.1.10Listen only if the IPv4 address matches net with the specific netmask:
net 192.168.1.0 mask 255.255.255.0To learn more about filter codes, type:
man 7 pcap-filterYou can learn more about iftop command by typing:
man iftop